OBSERVATÓR!O2016
A web-based platform for monitoring, structuring and visualizing the online response to Rio 2016 Olympic Games on Twitter
Web portal version 3.0
During the Games, we monitored some Olympic topics (athletes, episodes, sports rivalry, statements) that were creating buzz on Twitter and other issues related to our research. Then we took a deeper insight into these topics and wrote comments about them in our blog, accompanied by images, charts and tweets examples.
At the same time, we identified athletes with better performance in their respective sporting discipline and then created a new Twitter search query which we called Atletas category. After that we designed a visualisation in which the size of the bubbles represents the amount of mentions each one of the identified athletes received during the competitions.
Finally, we implemented temporal sliders in visualisations that have not yet presented this feature.
These are OBSERVATÓR!O2016 main page and visualization pages as they looked like in version 3.0.:
Home
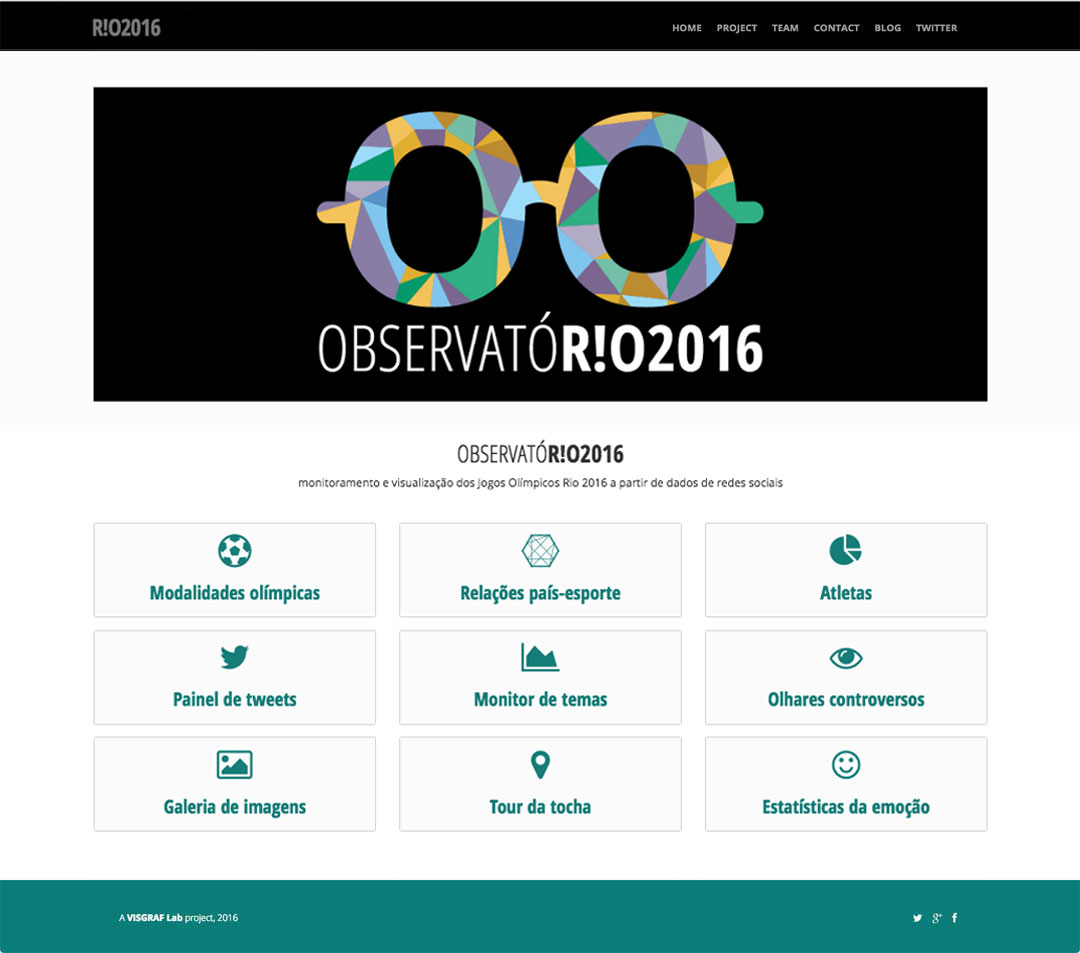
In version 3.0, OBSERVATÓR!O2016's home updated its main sessions including the new visualisation Atletas.
Atletas
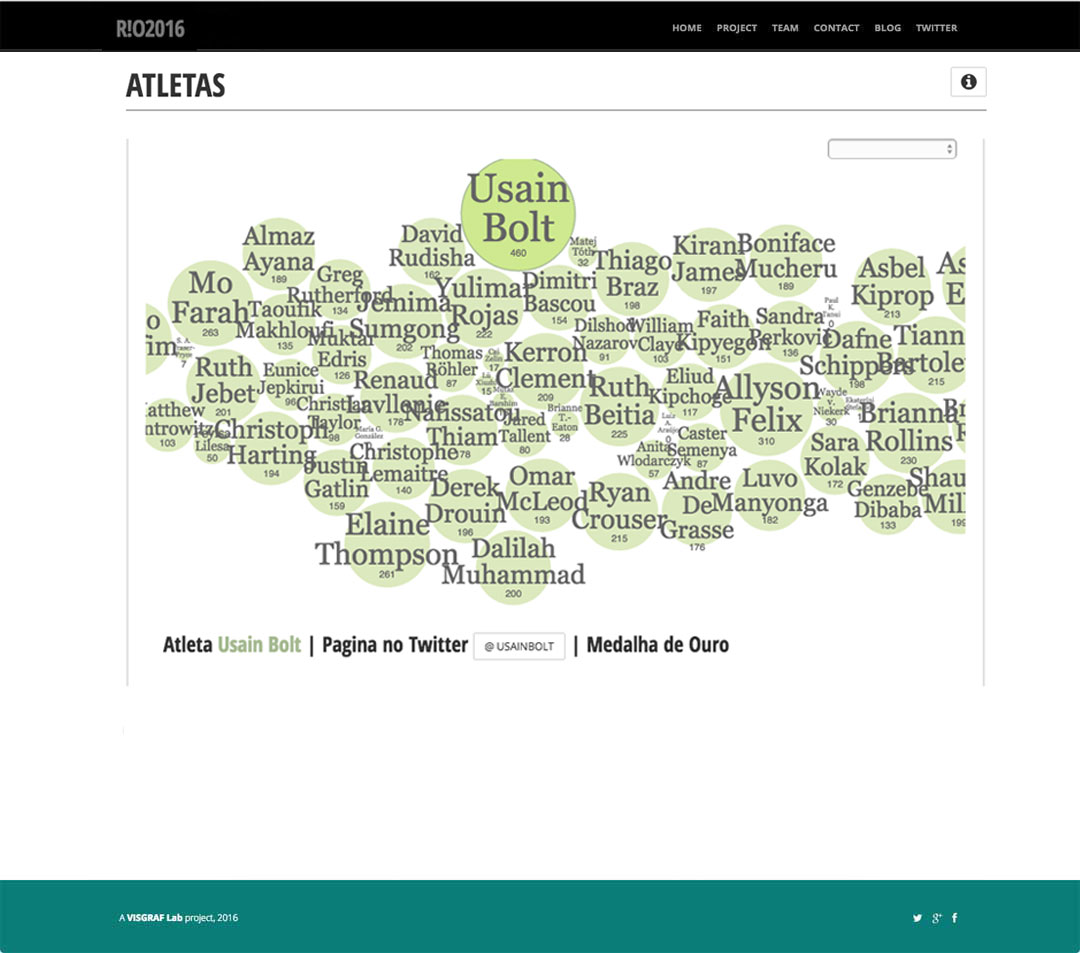
Athletes with better performance within their sporting modalities are represented in this visualisation based on their popularity on Twitter.
Blog
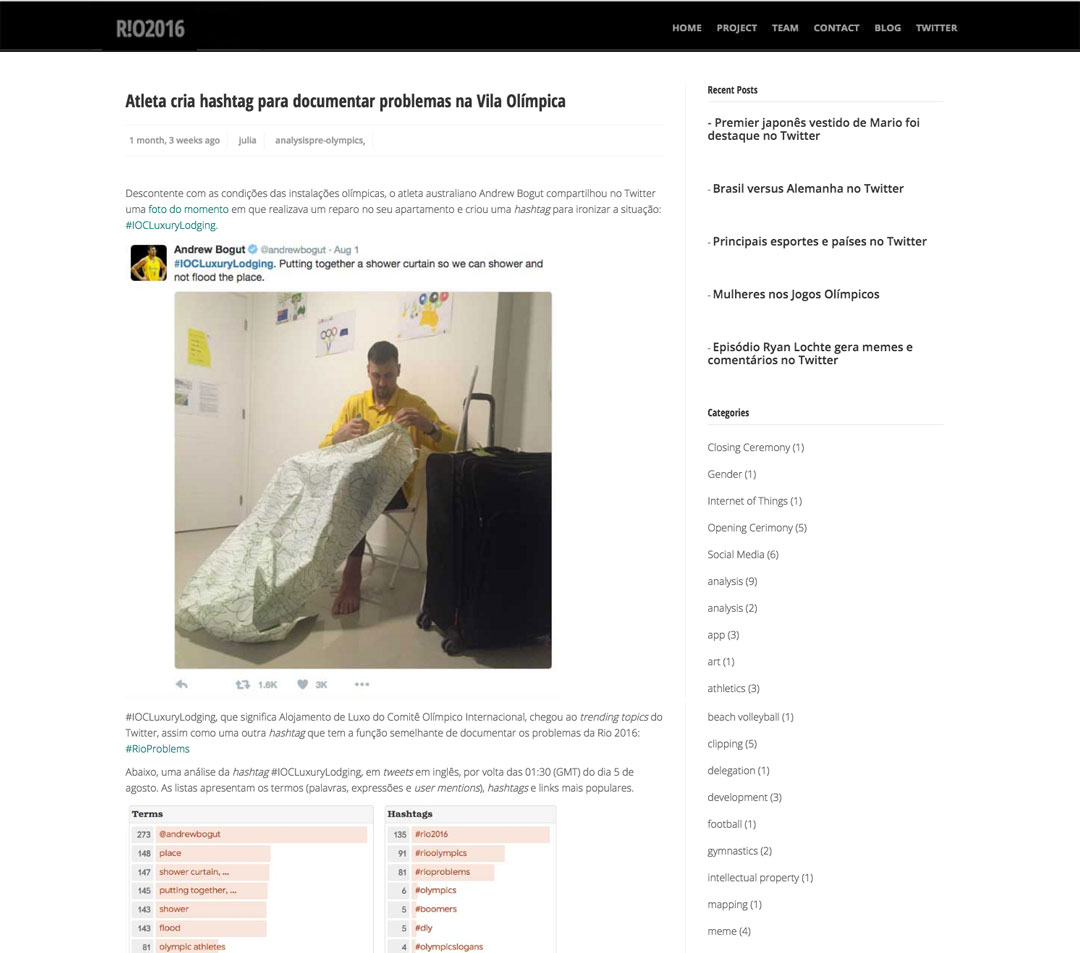
Through a participant observation, we highlighted some interesting topics about the Olympics and wrote comments in our blog.
Análises
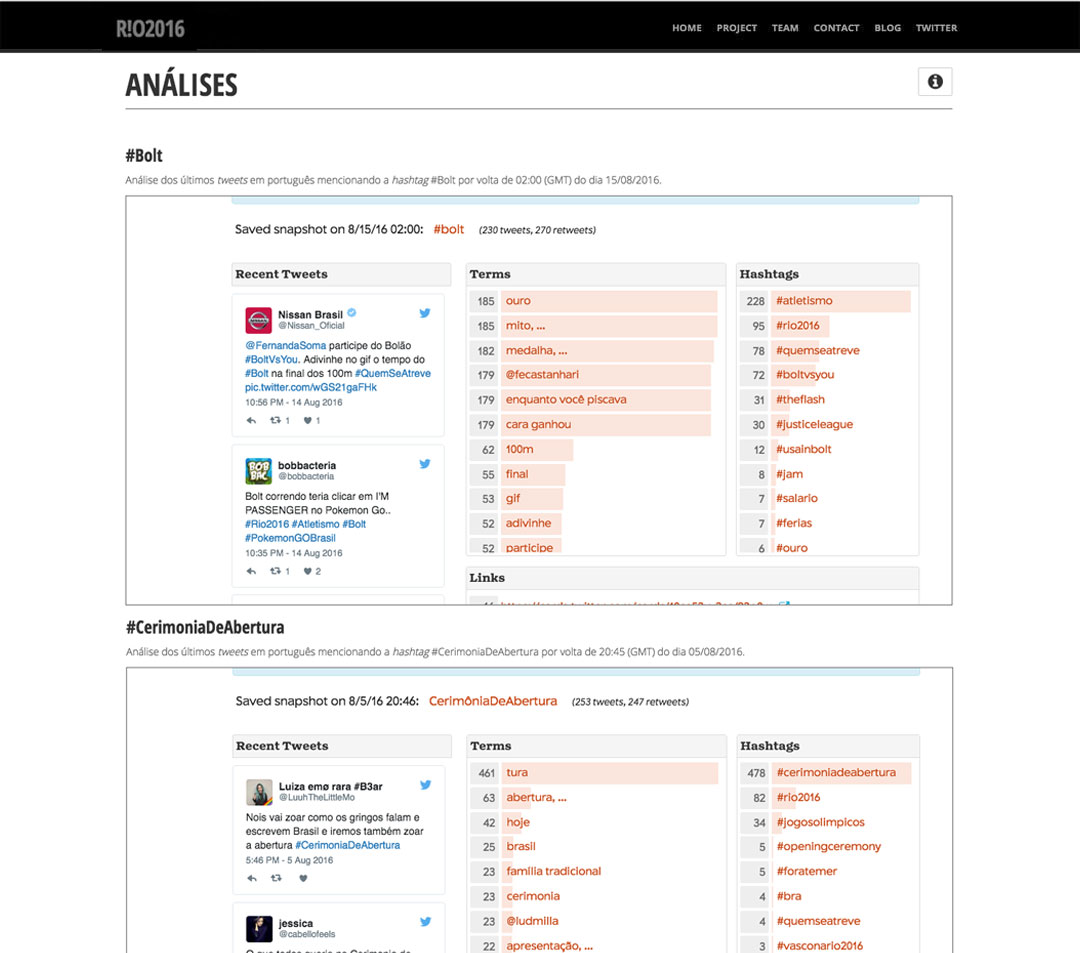
As a complement to the stories in our blog, we created an analyses page in which is possible to explore a snapshot of a Twitter hashtag or word. The analysis is possible due to TwXplorer tool.
Modalidades
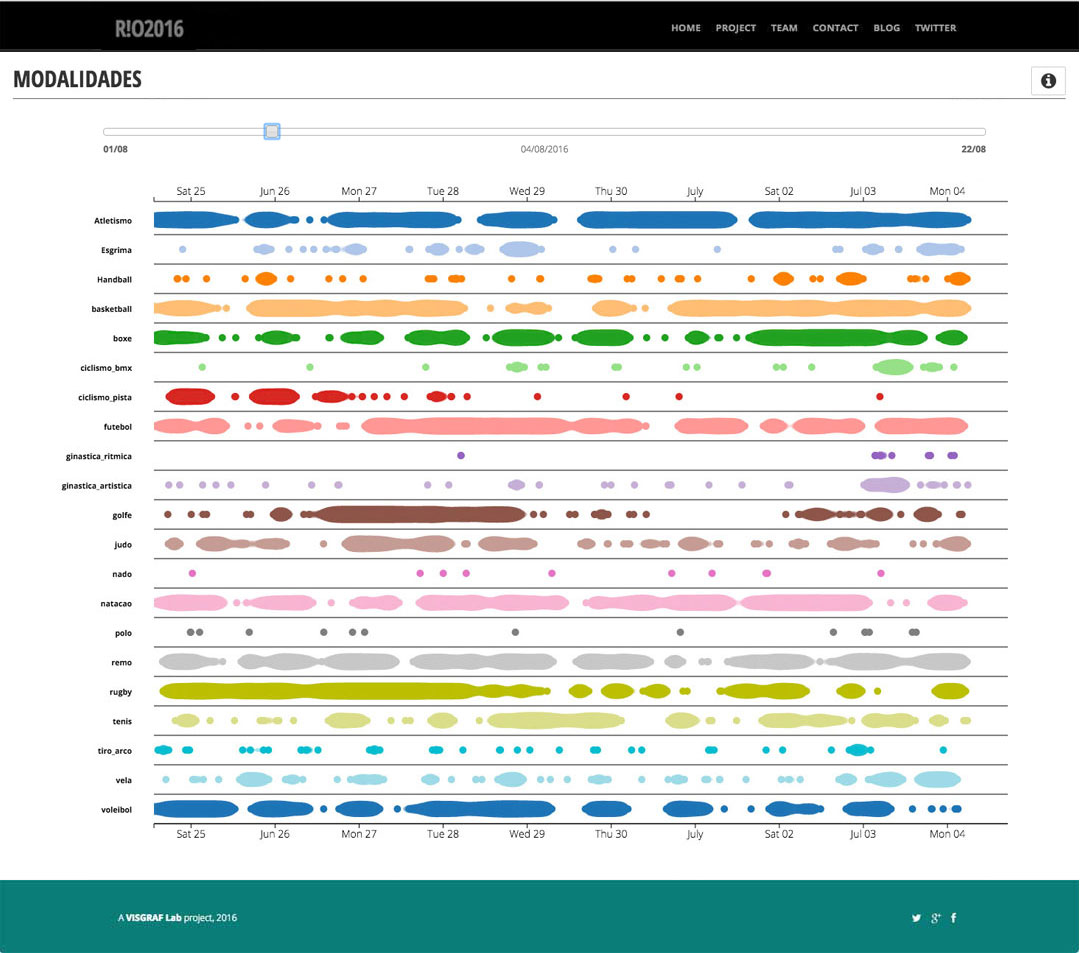
In version 3.0, we improved the user interface by adding a time slider using a time step interval of one day.
Relações
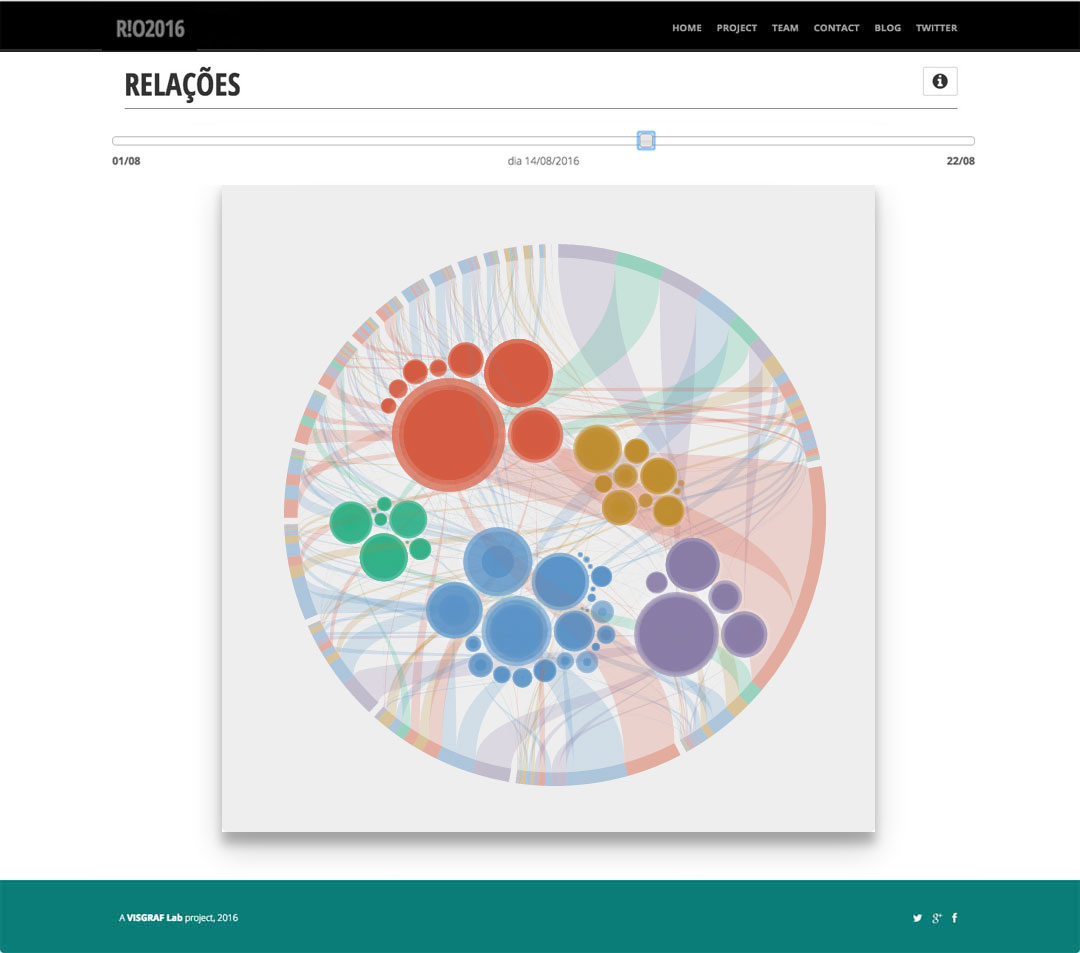
In version 3.0, we improved the the user interface by adding a time slider using a time step interval of one day.
Sentimento
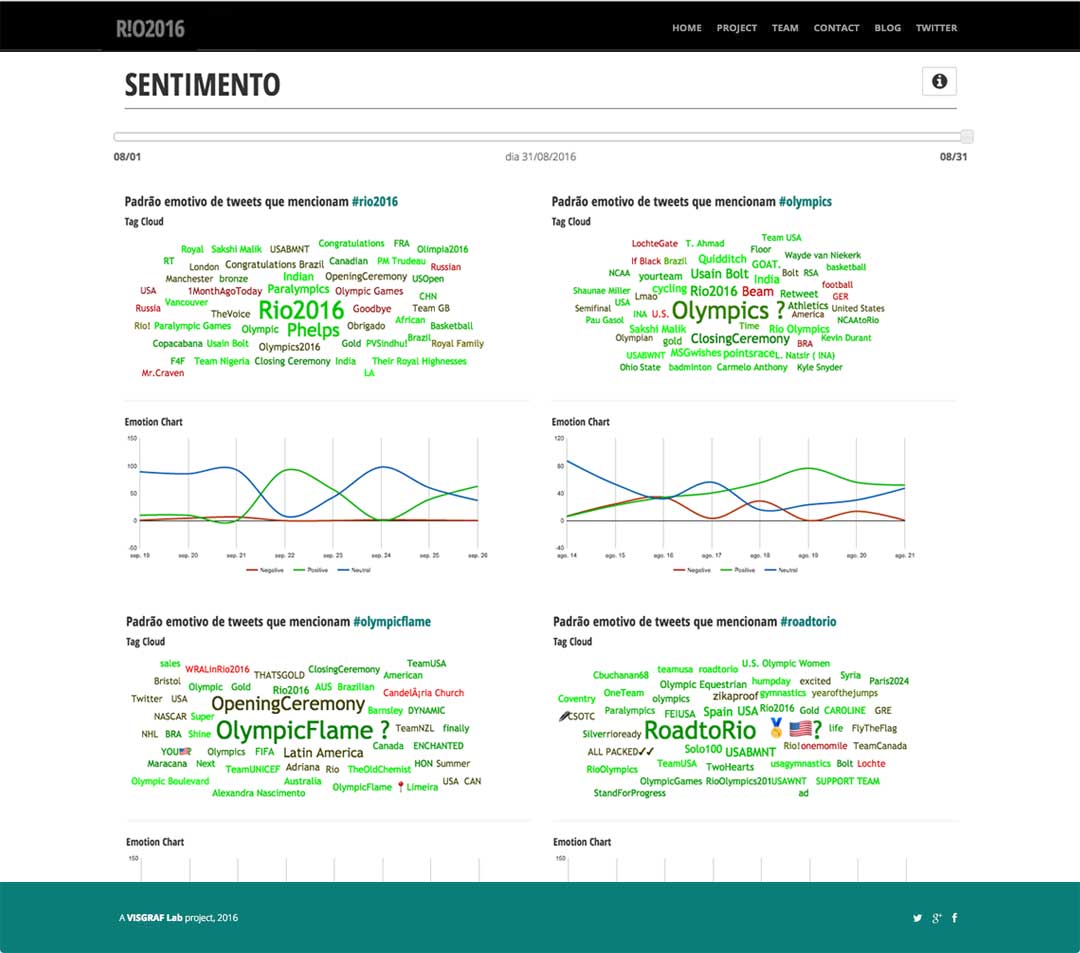
In version 3.0, we improved the the user interface by adding a time slider using a time step interval of one day.