OBSERVATÓR!O2016
A web-based platform for monitoring, structuring and visualizing the online response to Rio 2016 Olympic Games on Twitter
Web portal version 2.0
As the project unfolded and the Opening Ceremony got closer, we considered designing visualizations that highlighted interesting topics that were brought to light during the Olympic torch relay and other issues that would be in evidence during the competitions. This led our project to focus, on the one hand, on the backstage of a mega sporting event and, on the other hand, on the sporting disciplines and participating nations.
We explored more sophisticated visualizations capable of communicating layered meanings and improved some features from the older visualizations. The experiment “Trajetórias da Chama” was radically changed and ended up called “Tour da Tocha”. In this new version, we collected geo-tagged images from the Instagram account of @rio2016 and visualized them on a timeline map.
These are OBSERVATÓR!O2016 main page and visualization pages as they looked like in version 2.0.:
Home
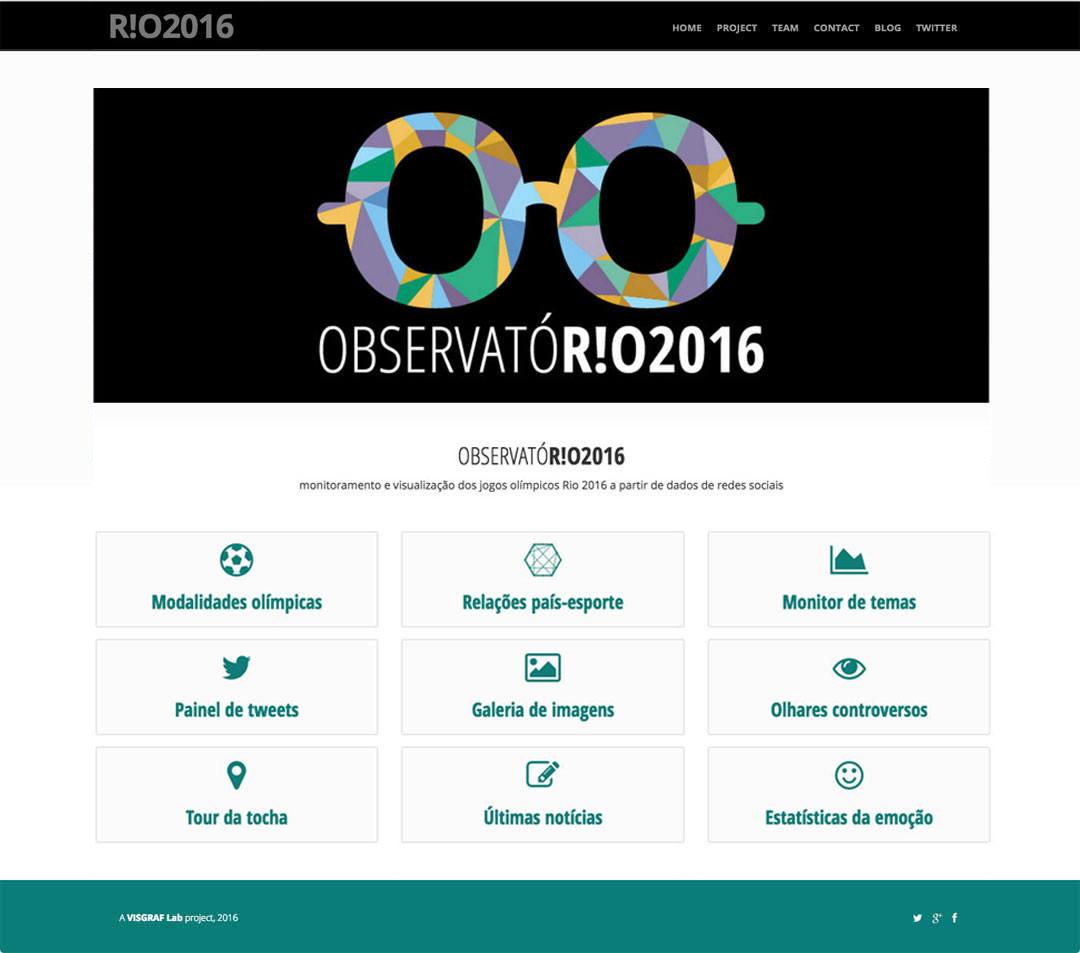
In version 2.0., OBSERVATÓR!O2016's home showed some design improvements, mostly for mobile devices.
Controvérsias
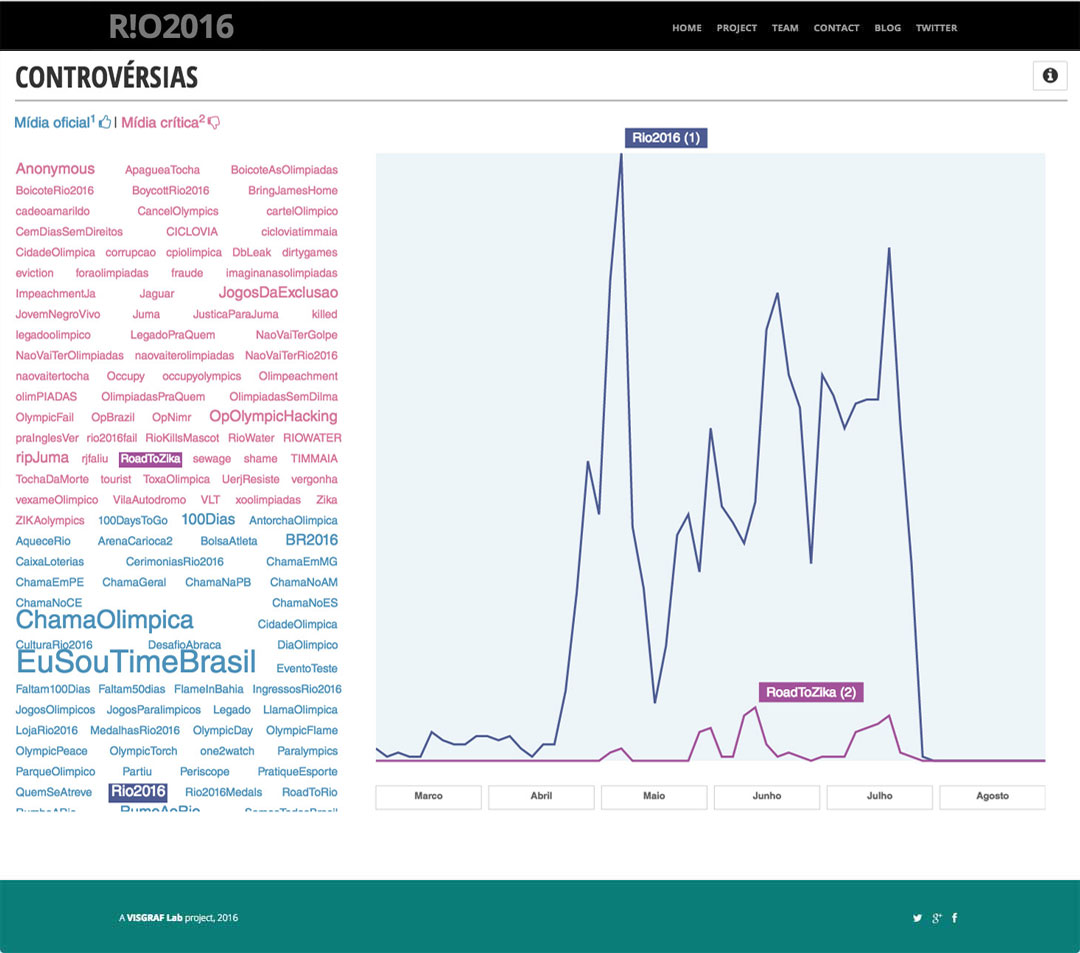
Controvérsias showed some content reorganization (from the hashtags selection to its presentation) and page layout improvement.
Tocha
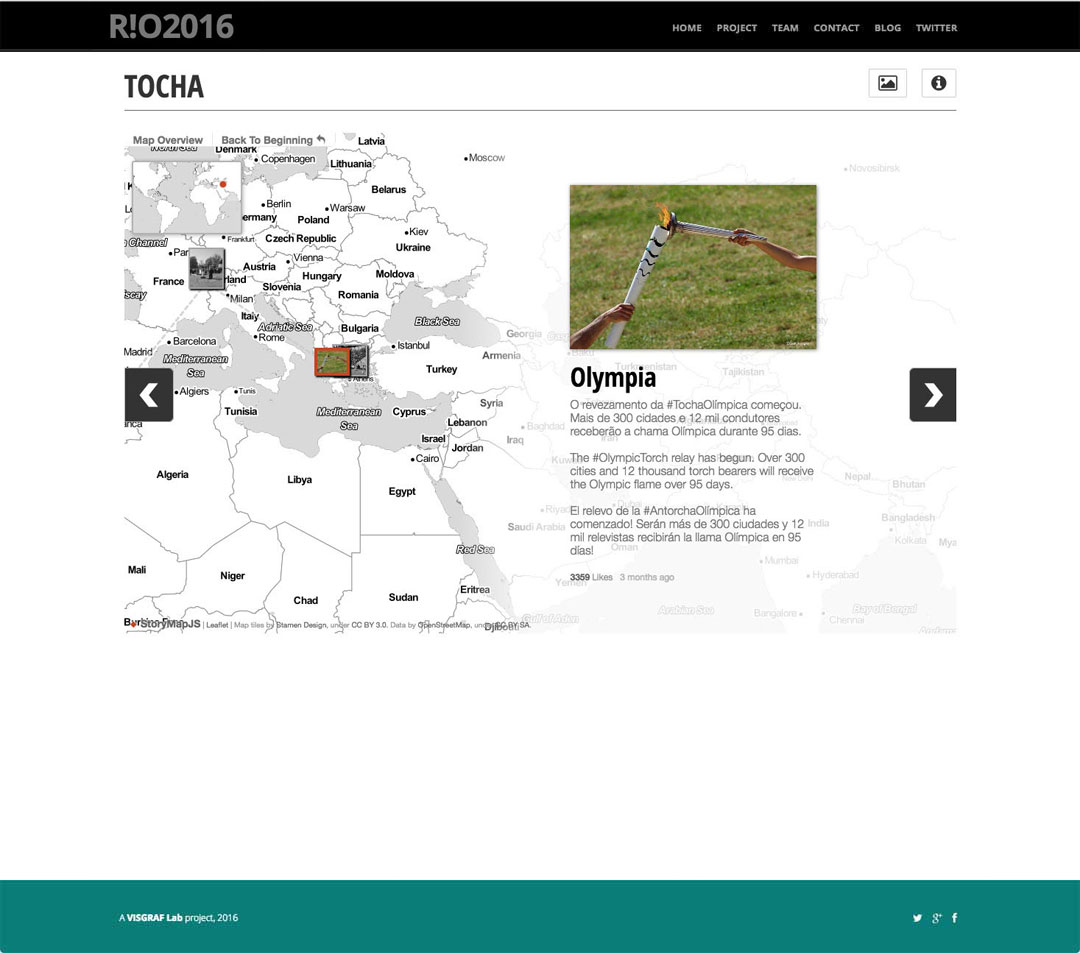
Geo-tagged Instagram images of the Olympic torch relay shared by @rio2016 are showed on a timeline map.
Mosaico
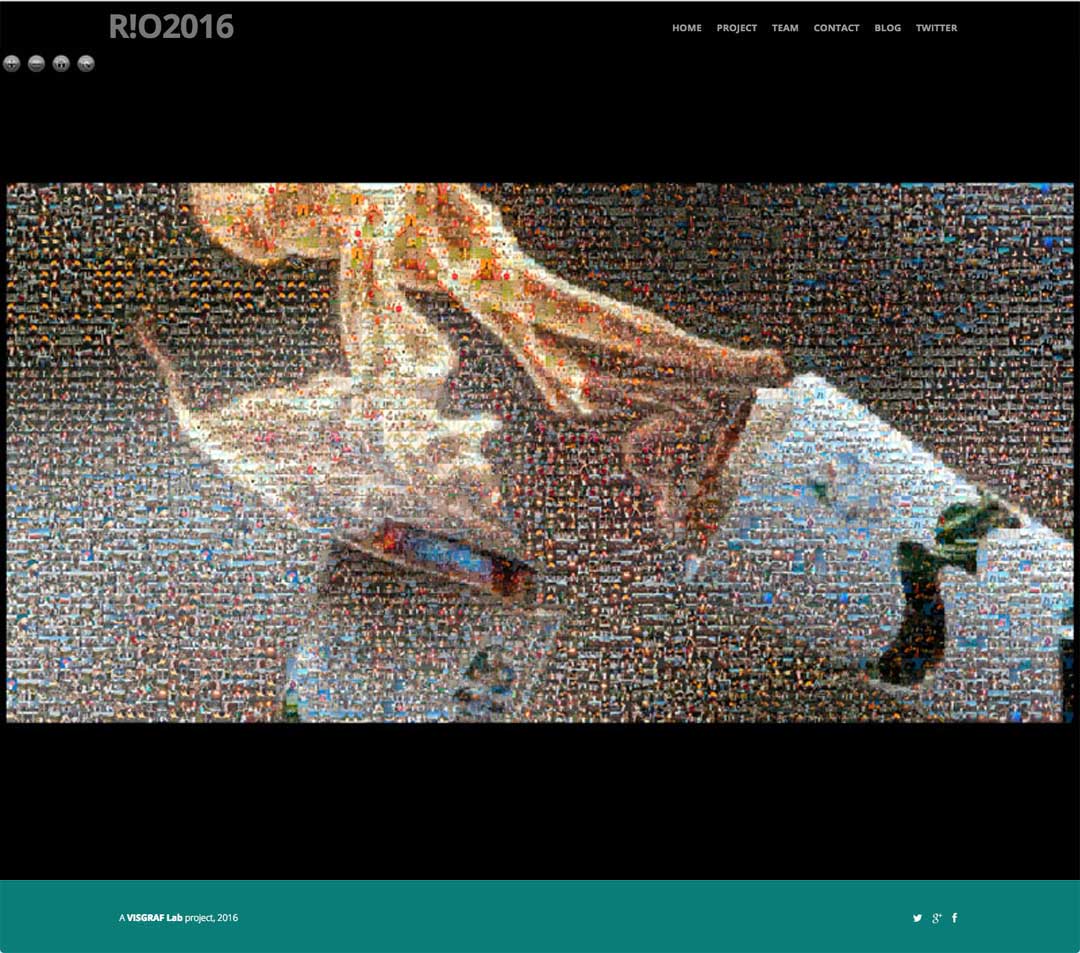
An interactive mosaic made from 5000 images of the Olympic Torch captured from Twitter and labeled by deep learning techniques.
Modalidades
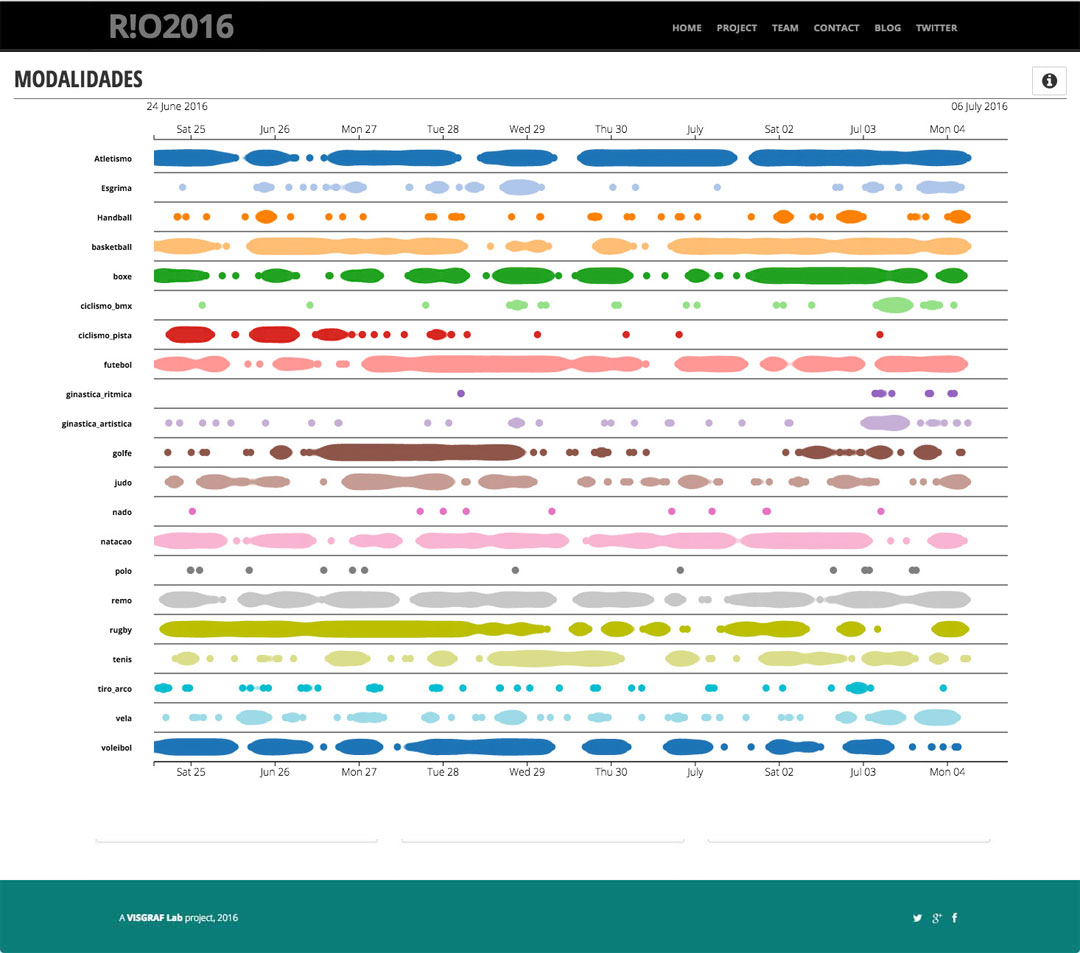
A time based event series interactive visualization that shows how olympic sports are mentioned in Twitter.
Relações
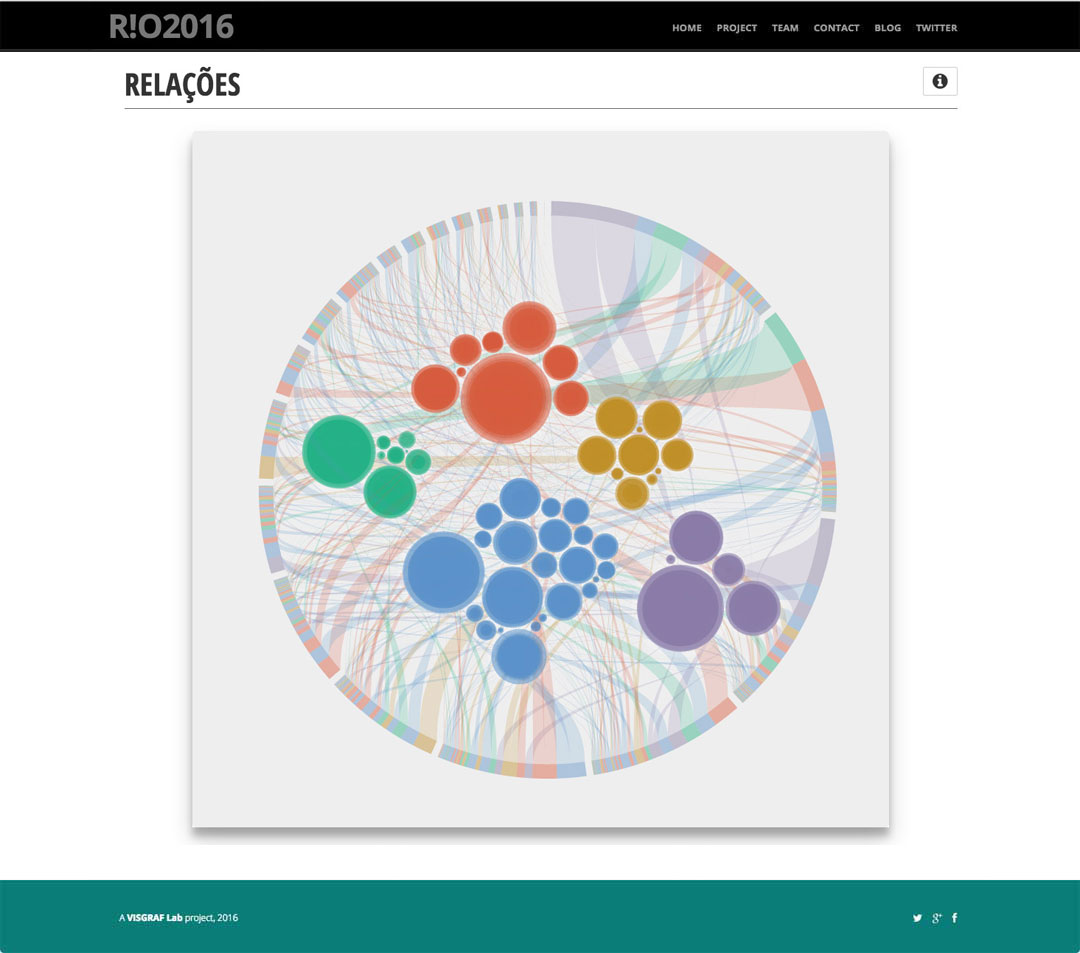
Bi-lateral connections between olympic sports and participating nations of Rio-2016 based on text analysis.
Temas
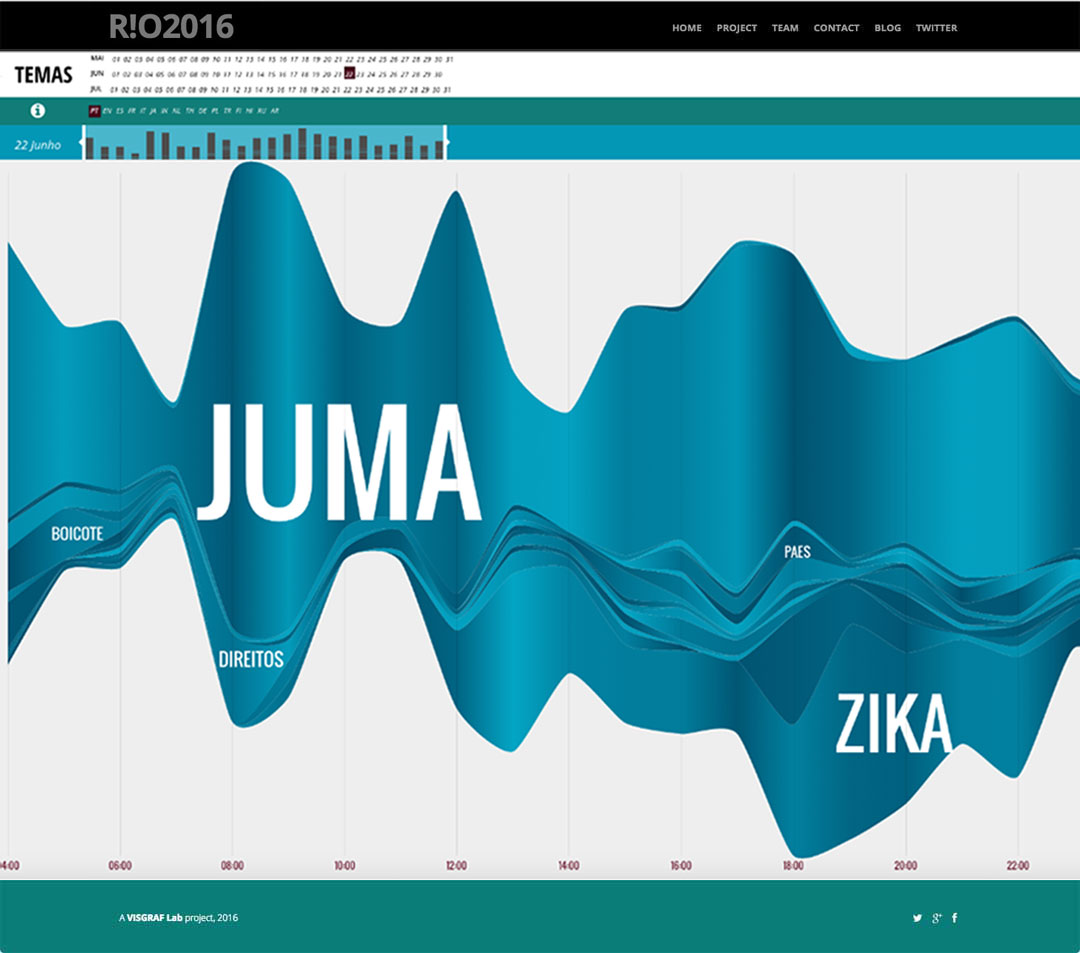
Monitor de temas identifies and represents what people are saying on Twitter about Rio-2016 during three months before the Games.