OBSERVATÓR!O2016
A web-based platform for monitoring, structuring and visualizing the online response to Rio 2016 Olympic Games on Twitter
Web portal beta version
Working with high volumes of data streams is a challenge. More than designing a custom hardware and software infrastructure to collect, parse and represent data, it’s necessary to approach visualisation problems with precise questions and accurate strategies.
The design process of OBSERVATÓR!O2016 visualizations has been through four main phases. The beta version of the Web Portal was launched on March 2016 and focused on bringing together tweets (text and media) and news exclusively from the Olympics “official" source, that is the twitter account in portuguese and website of the Rio 2016 Olympics and Paralympics Games. The temporal apprehension of the experiments designed at this stage was essentially static and inert, snapshots that captureded a especfic moment of the Pre Olympics.
These are OBSERVATÓR!O2016 main page and visualization pages as they looked like in version beta:
Home
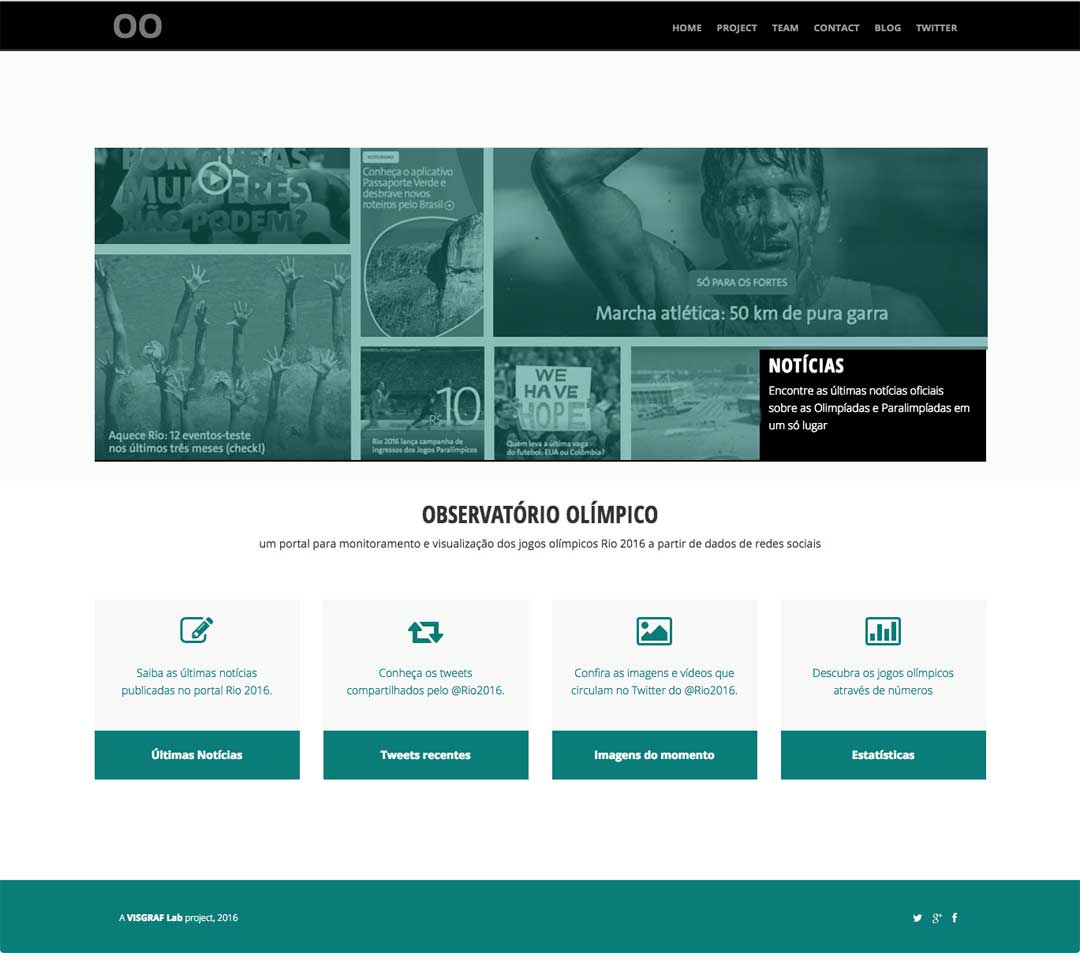
Home designed upon a basic template theme from Mezzanine (CMC built using on Django Framework).
Notícias
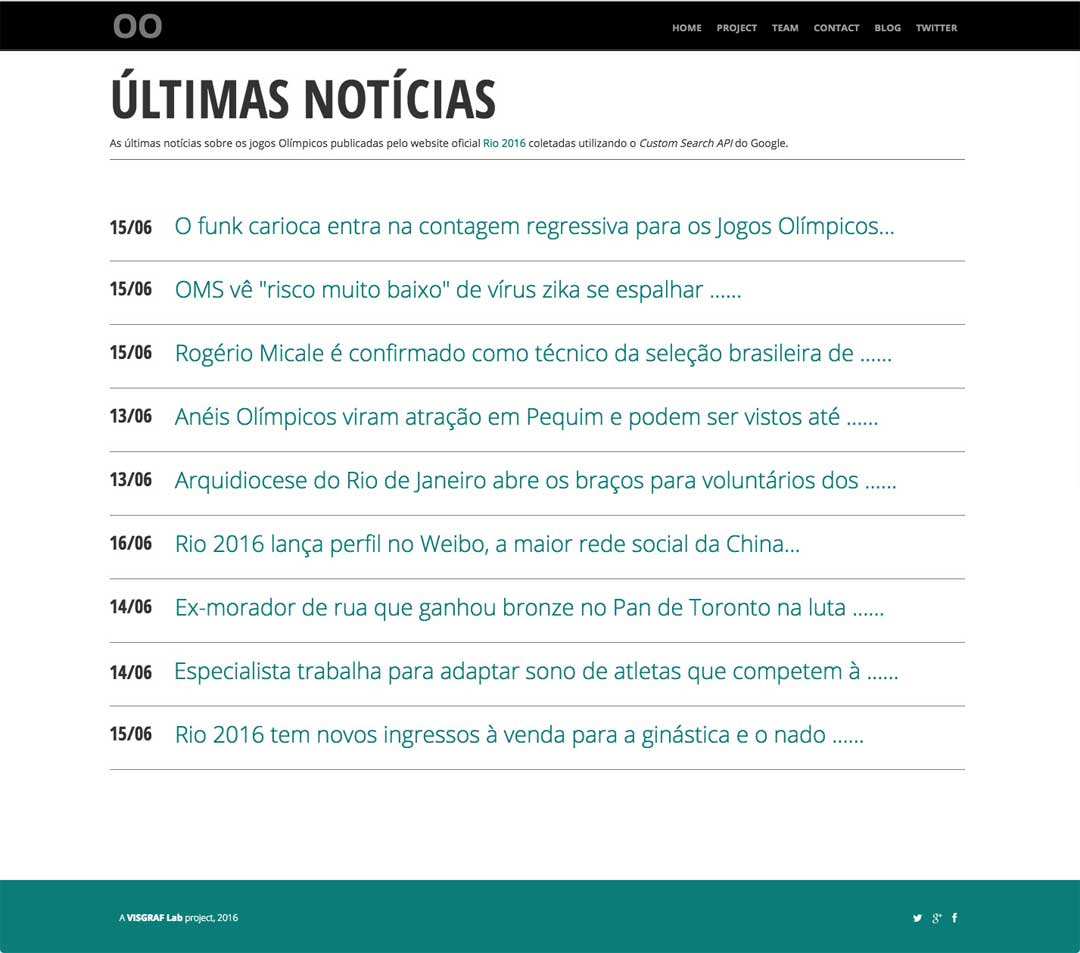
The latest news about the Olympic Games published by the Rio 2016 official website collected using Google Custom Search API.
Sentimento
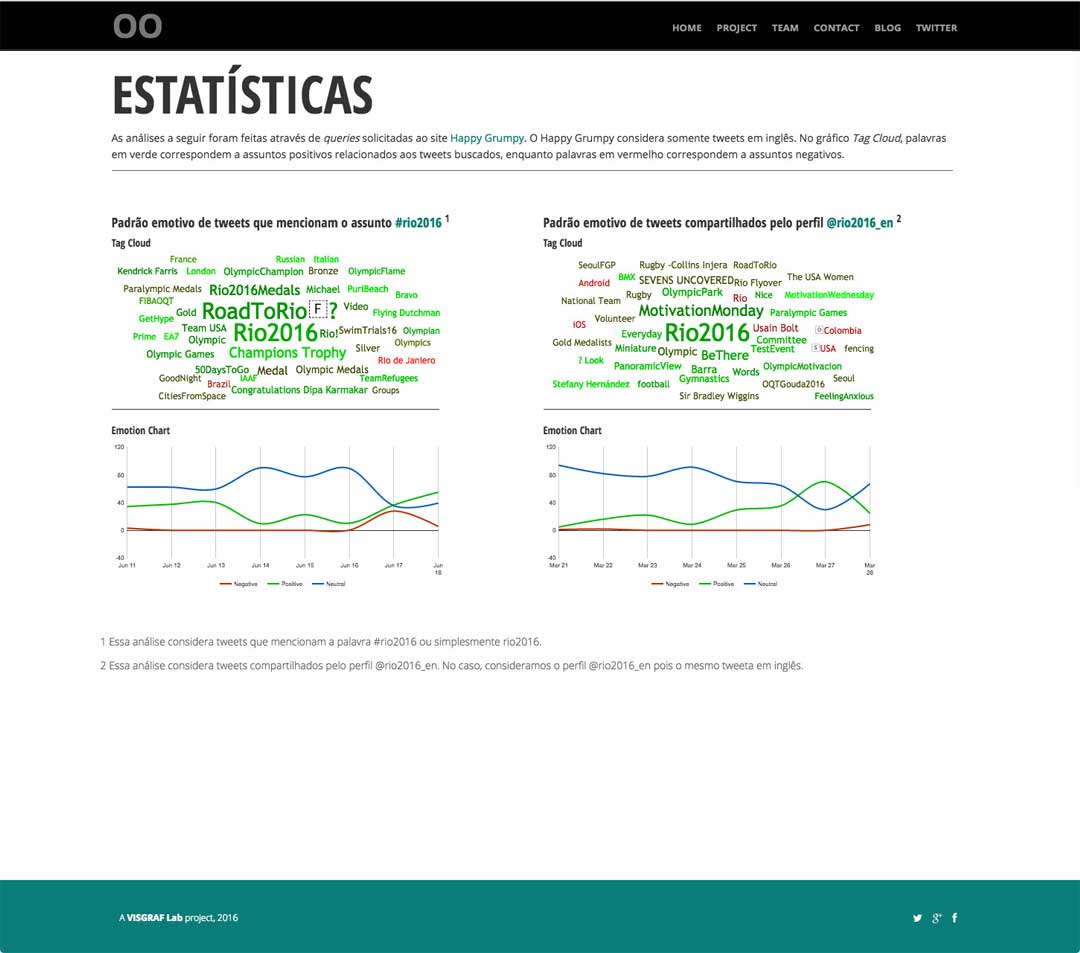
Emotional patterns in tweets mentioning #rio2016 and in tweets (in english) shared by @rio2016_en.